Whether delivered online or on-premises, our instructor-led Prometheus live training courses utilize interactive, hands-on exercises to demonstrate the effective application of Prometheus for event monitoring and alerting.
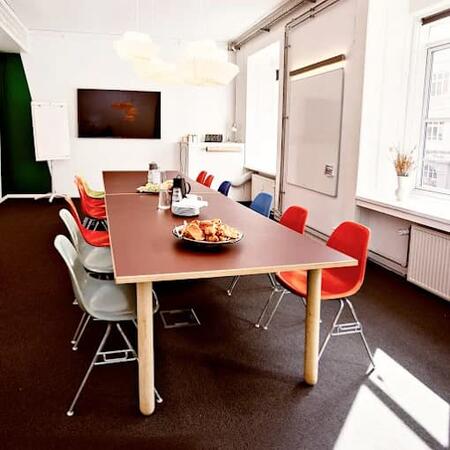
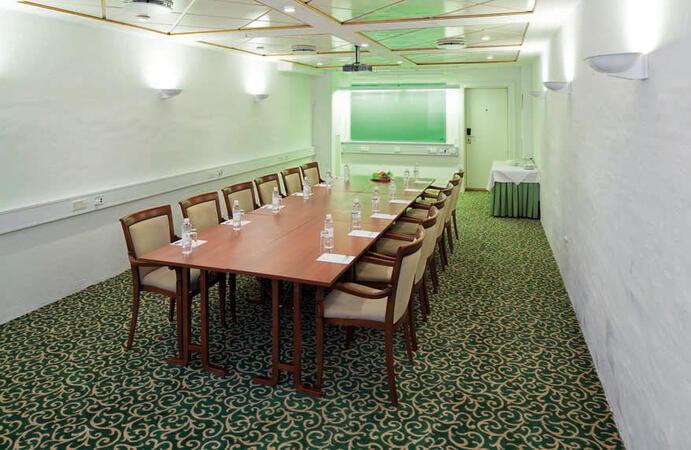
Prometheus training is offered in two formats: "online live training" and "onsite live training." Online live training, also referred to as "remote live training," is conducted via an interactive remote desktop. Onsite live training can be provided directly at your customer premises in Copenhagen or within NobleProg corporate training centers located in Copenhagen.
You can also take bus 26 or 7A and get off around Vesterbros Torv; from there it is a short walk.
By bus
Useful nearby stops include:
Vesterbros Torv (Vesterbrogade) — about 1 minute from the area.
Frederiksberg Allé (Vesterbrogade) — nearby.
Trommesalen (Vesterbrogade) — nearby.
Bus 26 and 7A serve the Vesterbrogade corridor.
København, Copenhagen
NobleProg København, Bredgade 37, København K, denmark, 1260
Near Amalienborg Palace & Royal Theatre.
If you arrive by train
If you arrive at Copenhagen Central Station (København H):
Walk to København H Metro.
Take the M3 or M4 metro toward Kongens Nytorv.
Get off at Kongens Nytorv.
Walk north toward Nyhavn, then continue along Bredgade.
Bredgade 37 is about 500 m / 6 minutes' walk from Kongens Nytorv.
Another easy option
Marmorkirken (Marble Church) Metro Station is also very close to Bredgade 37. The nearby Bredgade area is about 2 minutes' walk from Marmorkirken station.
By bus
There are bus stops around Dronningens Tværgade / Bredgade, so you can also travel by bus and walk the final few minutes.
Instructor-led training in Copenhagen for advanced IT professionals to master Grafana and Prometheus integration. Participants will configure production setups, connect diverse data sources, build advanced dashboards with variables, and implement robust alerting systems within distributed environments.
Targeted at advanced DevOps engineers and SREs, this instructor-led, live course in Copenhagen (online or onsite) provides the skills necessary to manage and scale Prometheus and Grafana within large-scale environments.
By the end of the session, participants will be able to:
Build Prometheus and Grafana architectures for large-scale and distributed contexts.
Boost Prometheus performance for high-traffic applications.
Set up Grafana to process large datasets and complex visual elements.
Execute advanced troubleshooting and scalability plans.
This instructor-led, live training (online or onsite) in Copenhagen is designed for intermediate-level developers and DevOps engineers aiming to instrument their applications for effective custom metric exportation and monitoring via Prometheus and Grafana.
By the end of this training, participants will be able to:
Recognize the significance of custom metrics in application monitoring strategies.
Instrument applications to publish custom metrics for Prometheus ingestion.
Build and configure Grafana dashboards to present custom metric data.
Adopt best practices for weaving monitoring into the development lifecycle.
This instructor-led, live training in Copenhagen (online or onsite) is tailored for advanced Kubernetes administrators and DevOps engineers looking to refine their monitoring capabilities using Prometheus and Grafana.
By the end of this training, participants will be able to:
Deploy Prometheus and Grafana for Kubernetes monitoring purposes.
Observe critical metrics for pods, nodes, and services.
Construct dynamic dashboards to visualize cluster health and performance indicators.
Implement alerting strategies that enable proactive problem-solving.
Apply industry best practices for scaling monitoring solutions in Kubernetes environments.
This instructor-led live training, available in Copenhagen either online or onsite, is tailored for advanced-level DevOps and SRE professionals aiming to refine their alerting and automation capabilities using Grafana and Prometheus.
By the conclusion of this training, participants will be capable of:
Developing and managing advanced alerting rules in Prometheus.
Connecting Prometheus Alertmanager with external tools via webhooks.
Accelerating issue resolution by automating alert responses.
Utilizing Grafana to visualize and manage alerts efficiently.
This live, instructor-led training in Copenhagen (delivered online or onsite) targets intermediate-level cloud and DevOps professionals seeking to strengthen cloud observability using Grafana and Prometheus.
By the conclusion of this training, learners will have the ability to:
Appreciate the benefits of integrating Grafana and Prometheus with cloud ecosystems.
Configure Prometheus for the supervision of cloud resources.
Adjust Grafana settings for the visualisation of service metrics.
Deploy cloud-native tools and integrations to support scalable monitoring.
This live, instructor-led session Copenhagen (available online or on-site) is tailored for intermediate DevOps and SRE professionals looking to develop high-impact dashboards and enhance their monitoring workflows through Grafana and Prometheus.
Once finished, participants will possess the skills to:
Apply best practices for designing effective dashboards.
Build and configure advanced Grafana dashboard elements.
Use Grafana templating for creating dynamic and reusable dashboards.
Implement alerting mechanisms to improve operational awareness.
Tailored for entry-level system administrators and DevOps engineers seeking to build core monitoring capabilities with Grafana and Prometheus, this live training session can be delivered either online or on-site in Copenhagen.
By the conclusion of this training, participants will be able to:
Comprehend the significance and purpose of monitoring within IT environments.
Install and configure Grafana and Prometheus to handle fundamental monitoring tasks.
Construct basic dashboards and alerts to visualize system performance.
Apply best practices for monitoring system availability and performance.
This instructor-led live training, delivered Copenhagen either online or onsite, is tailored for entry-level IT professionals and DevOps practitioners seeking to master the basics of Grafana and Prometheus.
By the conclusion of this training, participants will be equipped to:
Comprehend the purpose and key capabilities of Grafana and Prometheus.
Install and configure Grafana and Prometheus on a Linux system.
Configure basic data sources and build dashboards in Grafana.
Monitor system metrics and visualize data via Prometheus.
This live, instructor-led session in Copenhagen (online or onsite) targets system administrators and DevOps engineers seeking to utilize Prometheus for monitoring systems and applications, including native setups or dynamic microservices in cloud settings.
By the end of the session, learners will be able to:
Install and configure Prometheus.
Understand its features, architecture, and core principles.
Query data effectively using PromQL.
Develop visualizations and dashboards via Grafana.
Set up monitoring and alerting rules.
Analyze and optimize performance metrics for systems and applications.
Enable secure connections to remote endpoints and current systems.
Read more...
Last Updated:
Testimonials (1)
Relax, easy no pressure to complete the assignment
Online Prometheus training in Copenhagen, Prometheus training courses in Copenhagen, Weekend Prometheus courses in Copenhagen, Evening Prometheus training in Copenhagen, Prometheus instructor-led in Copenhagen, Prometheus instructor in Copenhagen, Online Prometheus training in Copenhagen, Prometheus classes in Copenhagen, Evening Prometheus courses in Copenhagen, Prometheus one on one training in Copenhagen, Prometheus boot camp in Copenhagen, Prometheus coaching in Copenhagen, Prometheus on-site in Copenhagen, Weekend Prometheus training in Copenhagen, Prometheus instructor-led in Copenhagen, Prometheus private courses in Copenhagen, Prometheus trainer in Copenhagen